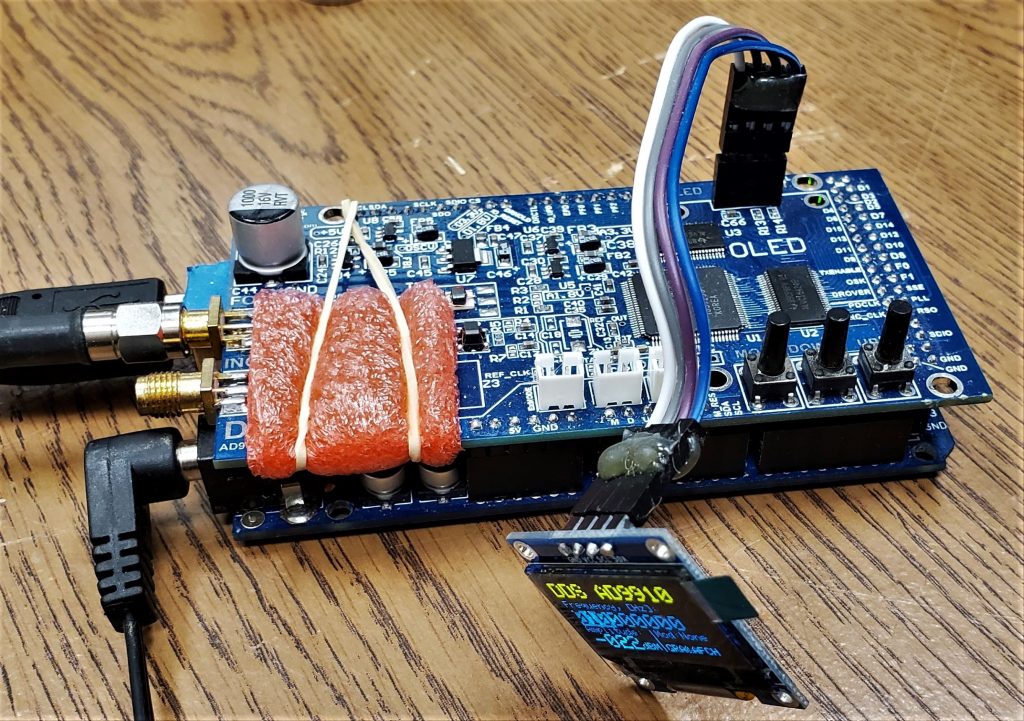
A fellow ham recently purchased and assembled a nice little signal generator kit consisting of a DDS AD9910 signal generator board/shield, Arduino Mega, OLED display, and TCXO option. I had borrowed it from him for the purpose of generating some modulated AM test signals to check the performance of some 20 MHz oscilloscopes I plan to distribute to some of the AM transmitter sites I maintain for clients of my broadcast engineering firm — Alabama Broadcast Services, LLC. My initial testing of the device’s output frequency showed it to be off considerably, so I spent some time adjusting the software settings in the device and got it aligned pretty nicely.
Initial Test Results Before Recalibration
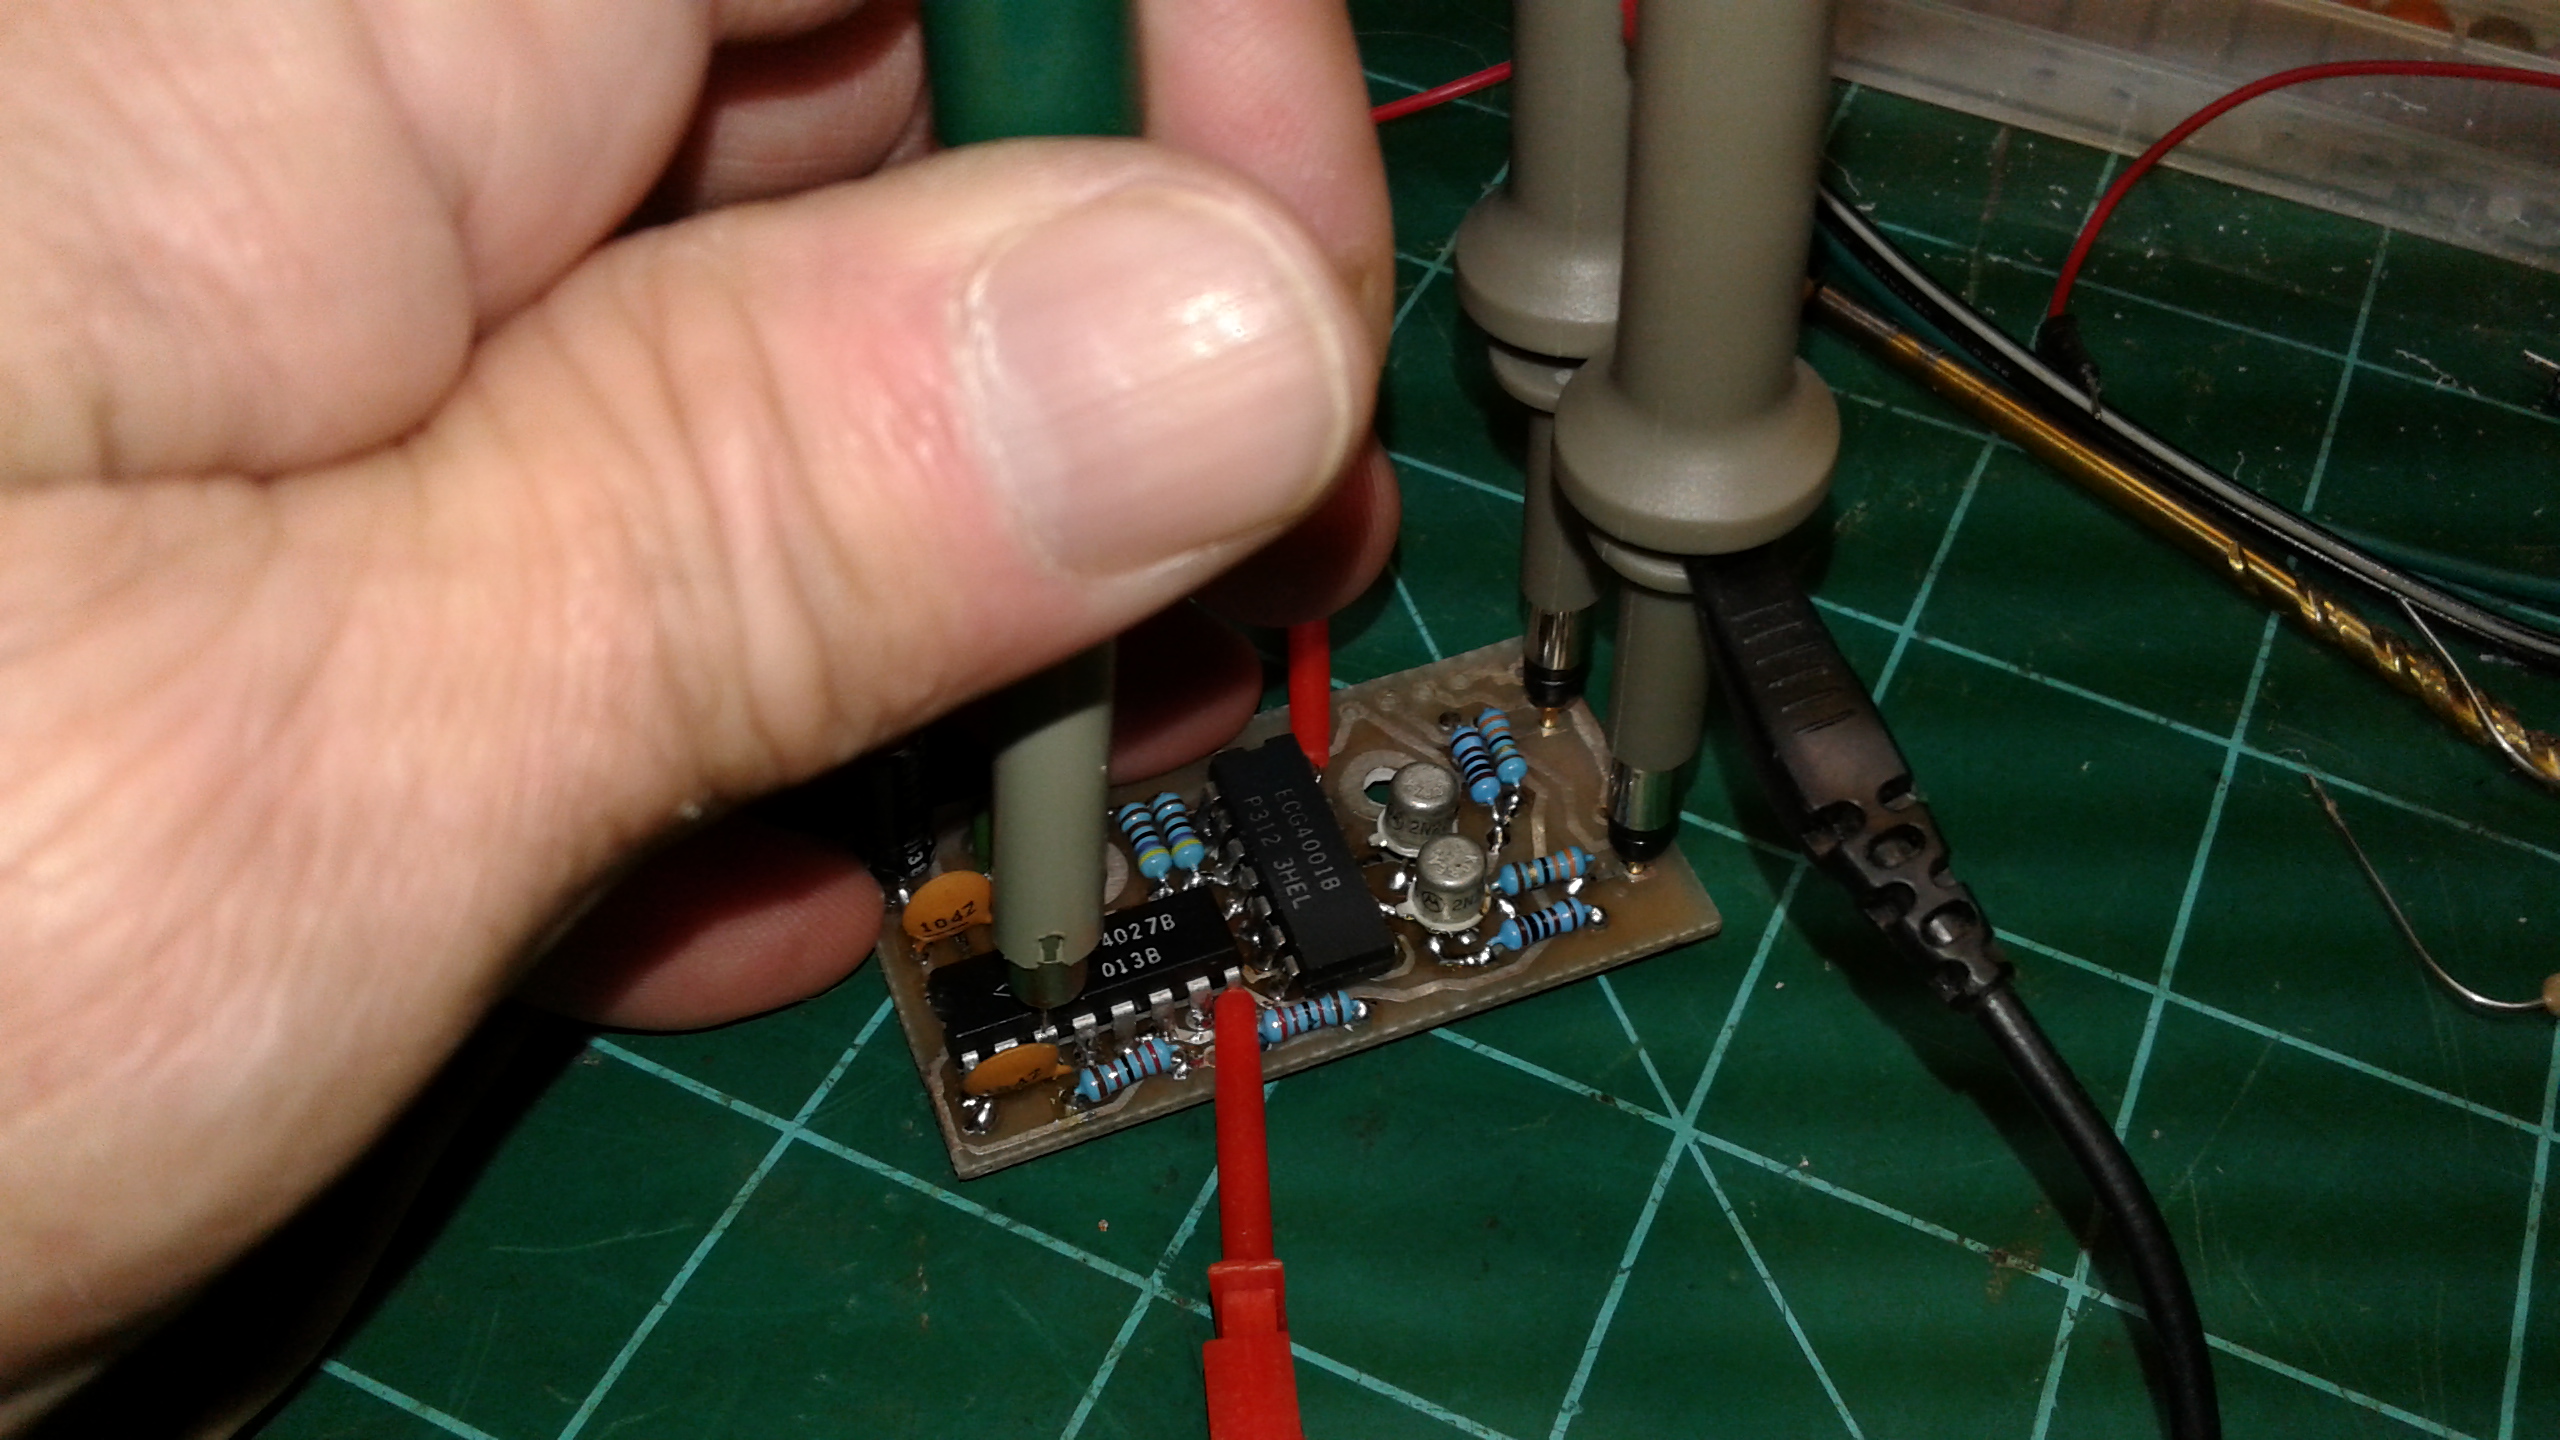
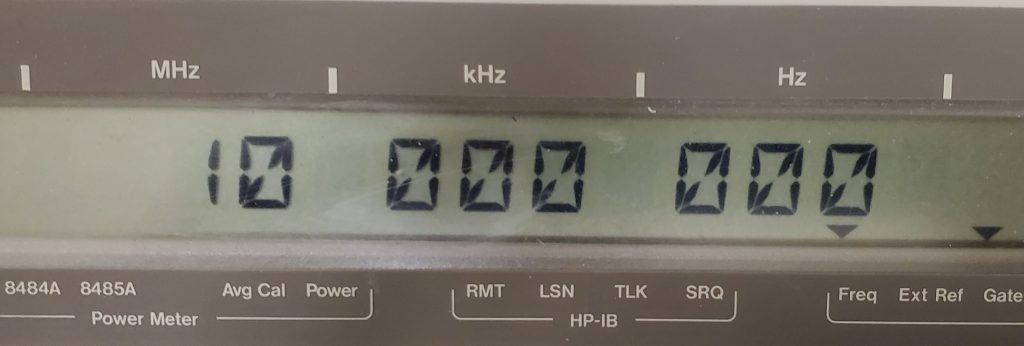
Initial testing showed the signal generator’s output frequency to be considerably different than the selected frequency.
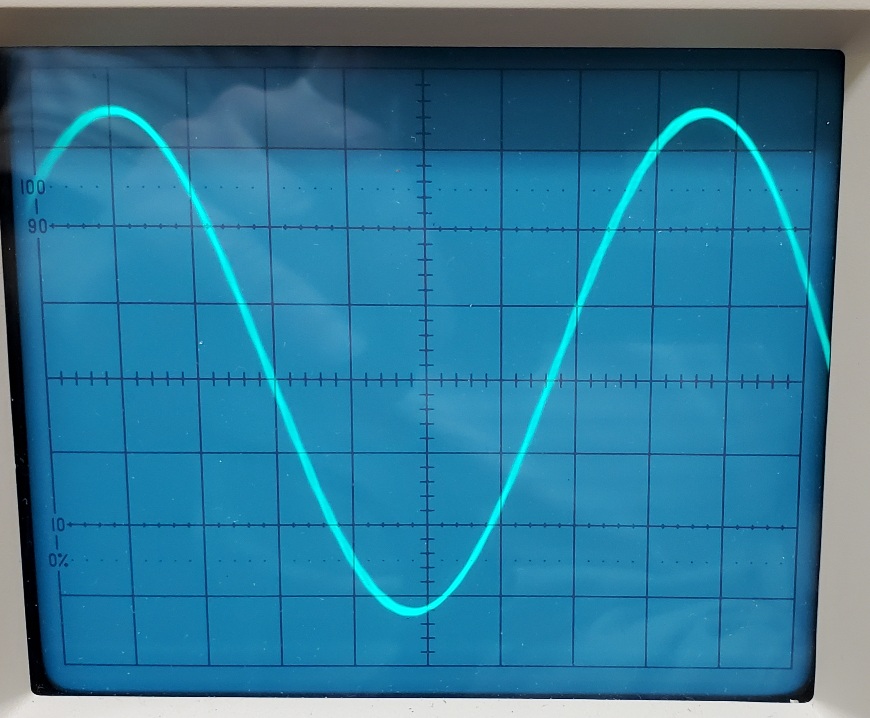
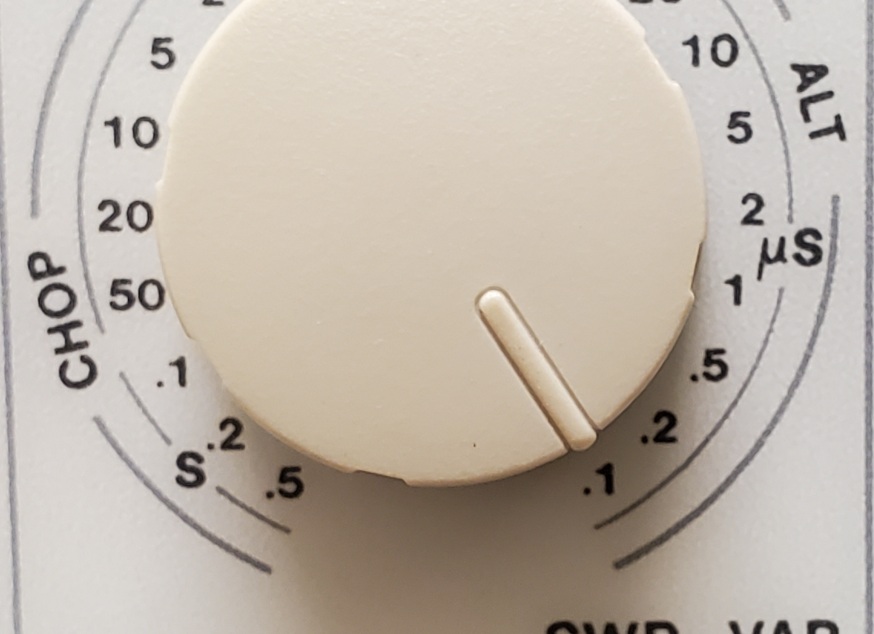
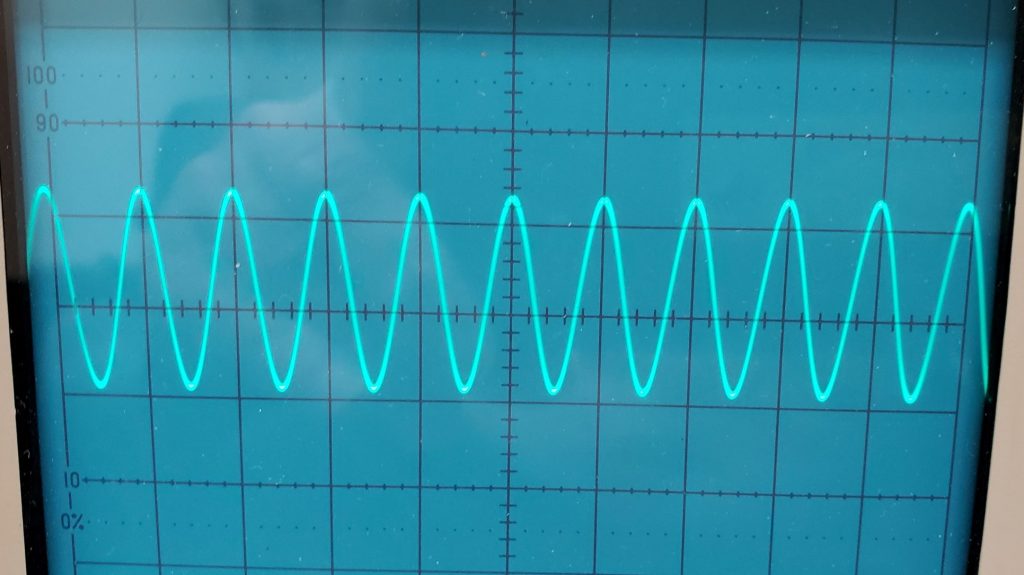
Referring to the oscilloscope trace, I counted roughly 7.7 major graticules. Multiplying that time 0.1 uS and taking the inverse of that value resulted in a measured output frequency of approximately 13.2 MHz — way off from the expected 10 MHz value.
Recalibration of the device for accurate output frequency
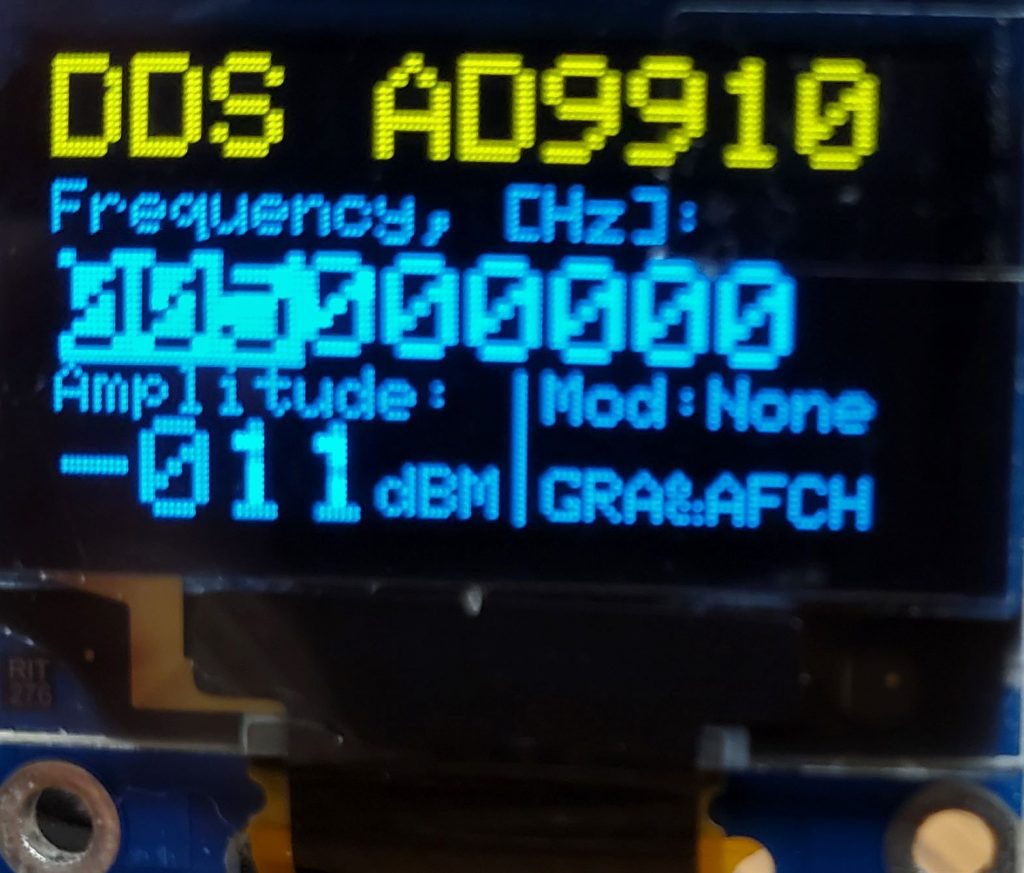
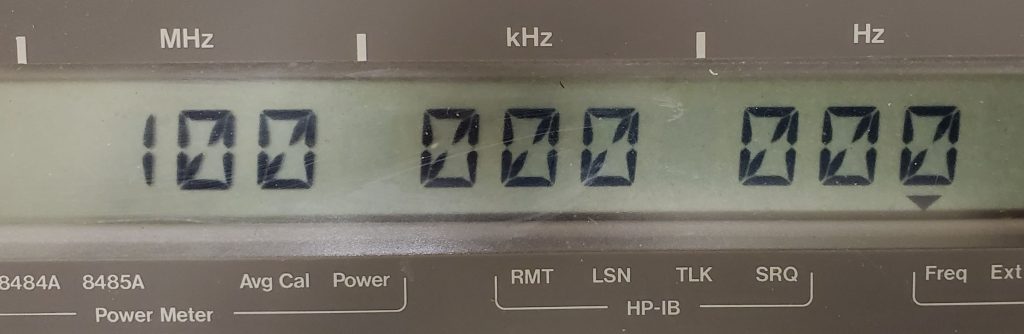
For the purposes of adjusting the settings and calibrating the output frequency, I opted to perform the output calibration at a frequency of 1.0 MHz.
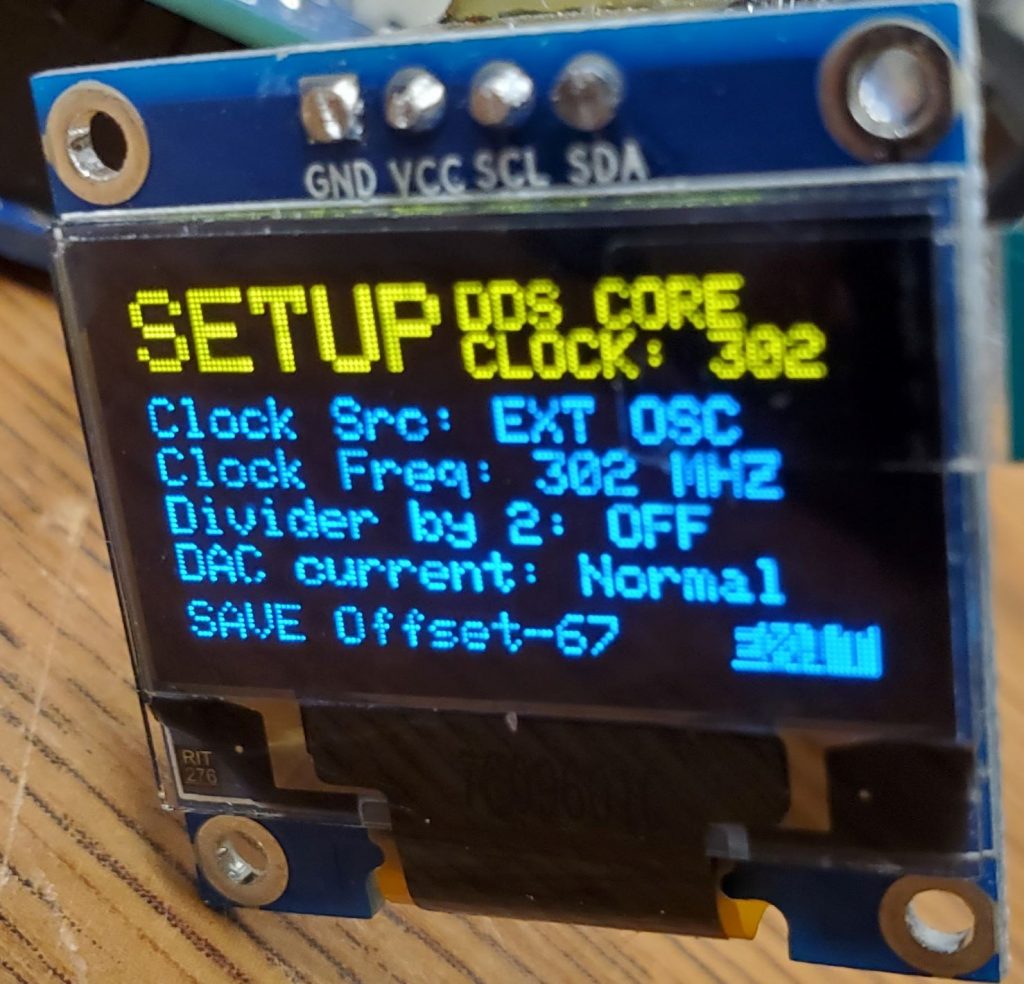
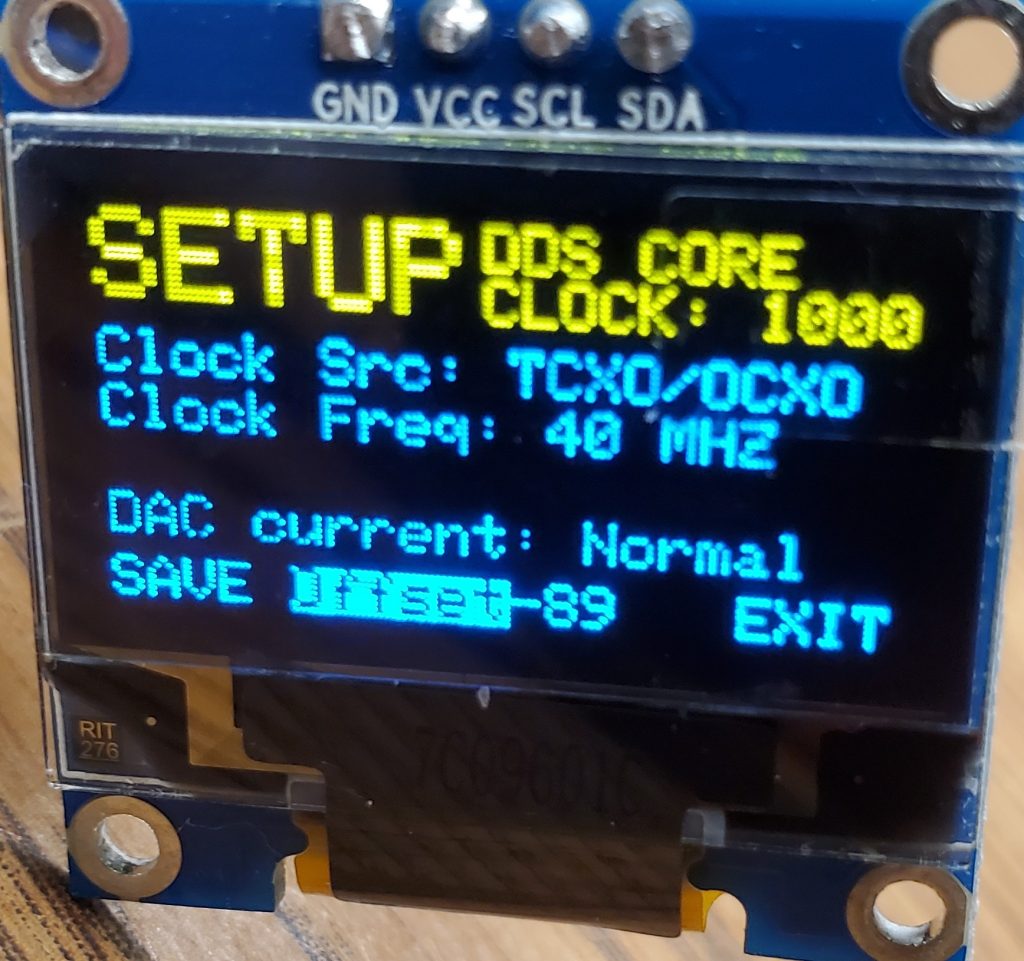
I wanted to calibrate the device to be as accurate as possible without the use of an external clock signal, so I changed that setting to “TCXO” so it would use the installed TCXO, after which I worked with the clock frequency and offset settings to calibrate the device for as close to 1.000000 MHz as possible.
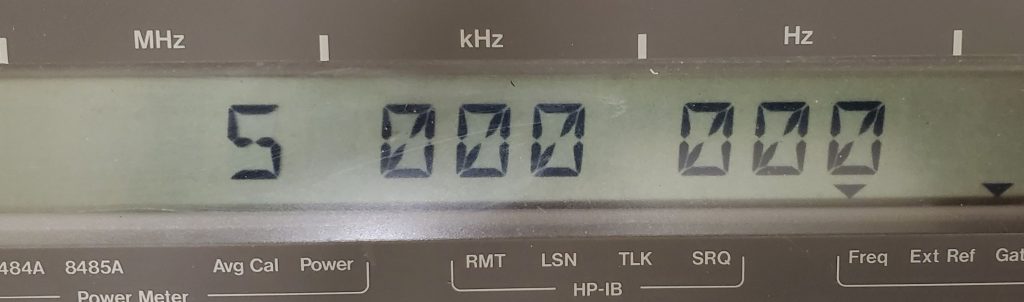
Testing the DDS AD9910 at 5.0 MHz after calibration. Let’s see how close it is…
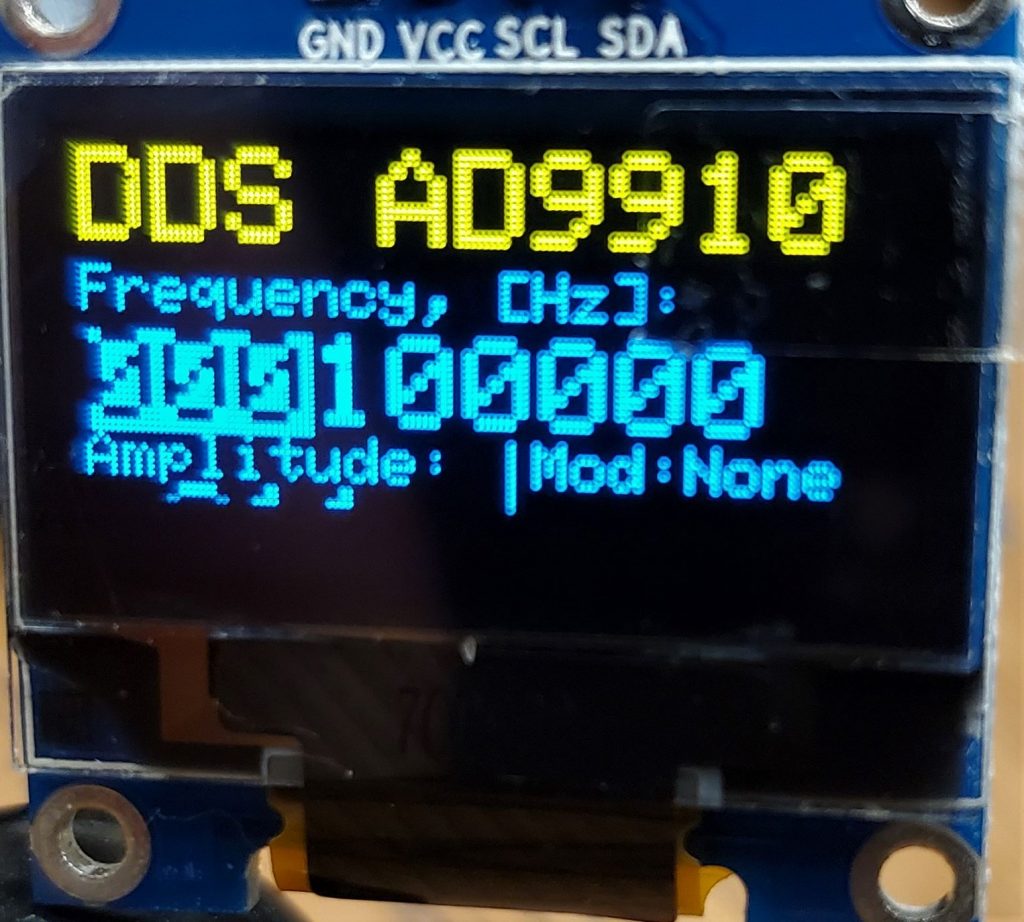
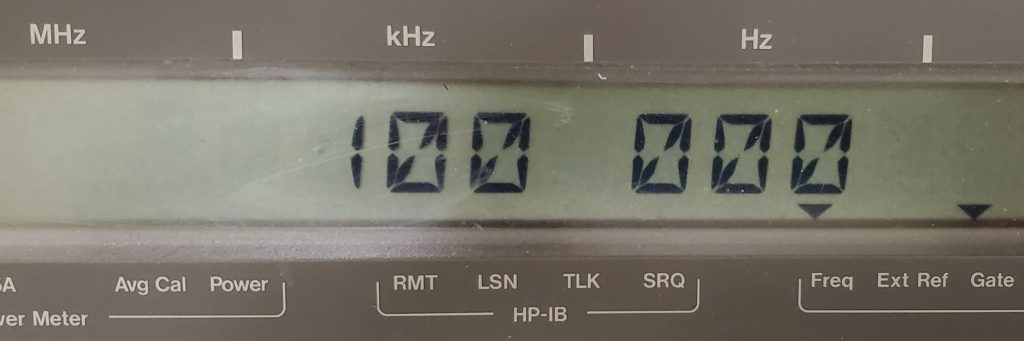
So, now let’s try it dialed-down to its minimum output frequency of 100 KHz…
Now let’s see how it does at some higher frequencies…
Continued testing all the way up to 400 MHz showed the device to be extremely accurate. In fact, at 400 MHz, the frequency measured 400.000014 MHz, an error of only 3.5 to the minus 8th, or — to phrase it another way — 0.035 ppm frequency error. I’d say that’s quite impressive for a device which cost around $160. I’ve seen devices costing up into the thousands of dollars which don’t perform nearly that well.
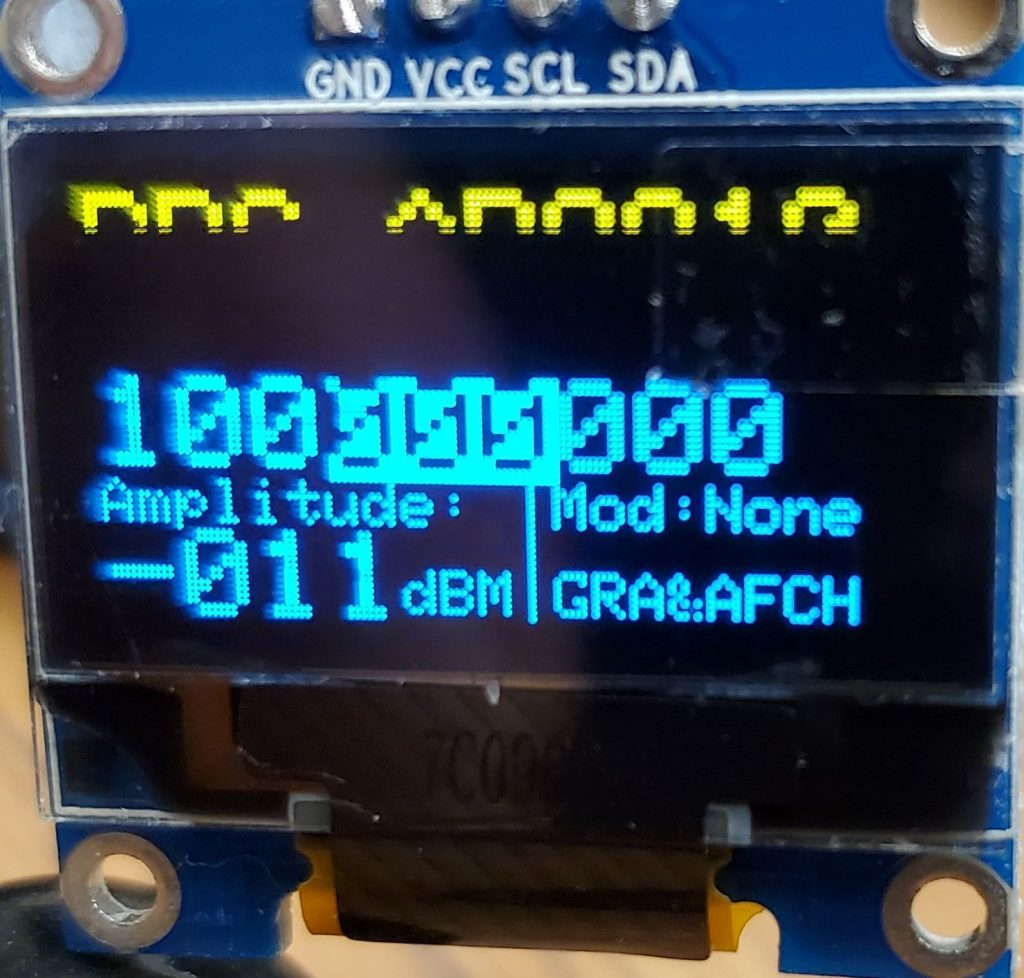
Oscilloscope and Spectrum Analyzer Views At 100 MHz output setting…
Summary and My Opinion
Overall, I give this device high marks. At the price point of around $160, I have not yet handled or tested another device that’s this accurate in terms of frequency accuracy and stability, although there are probably some out there, given the proliferation of inexpensive yet relatively sophisticated signal generators which have hit the market as of late. The frequency was not difficult to get calibrated and far exceeded my initial expectations. I’d say my friend definitely got his money’s worth. Now… if he’ll just get to work on 3-D printing a case to hold it and make it convenient to use, I just might have to purchase one for my lab bench and tool bag!
PS: Further Testing and Notes After Device Left Running for An Additional Hour Or So After Calibration and Testing…
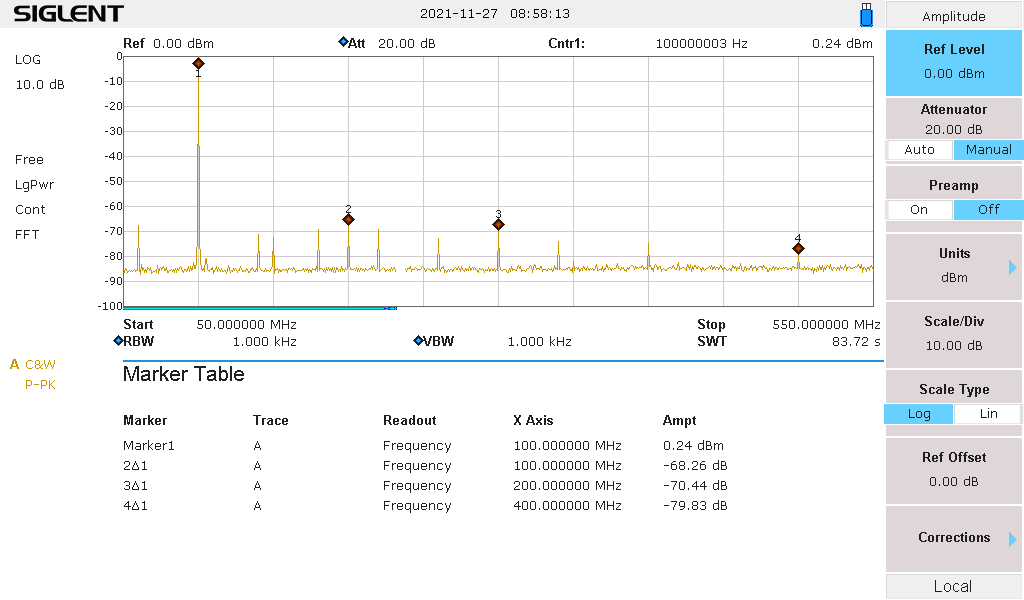
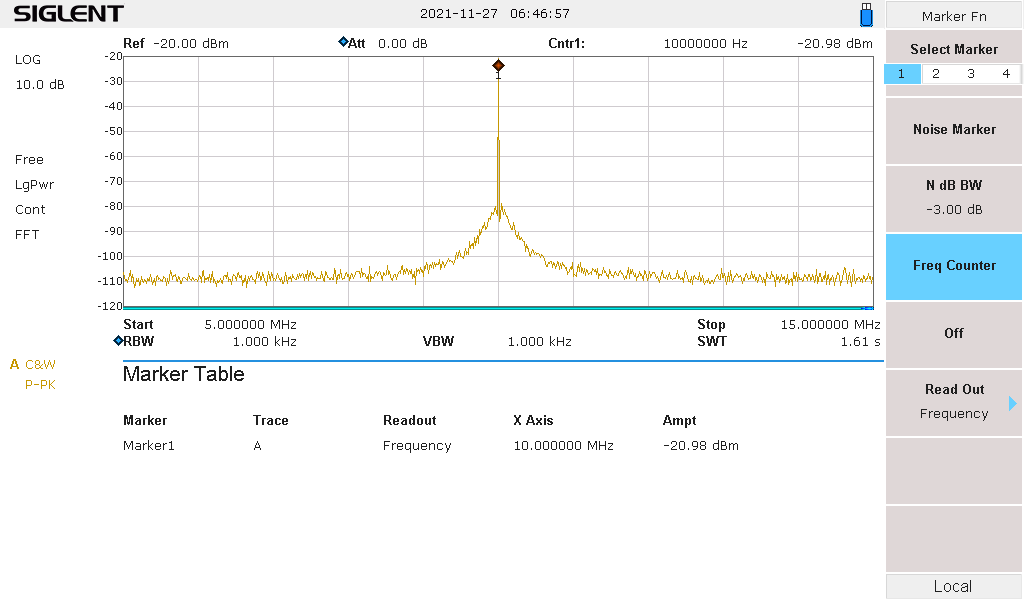
The device is producing some harmonics, but they are notably lower in amplitude than the set frequency. As seen in this spectrum analyzer capture, with the device set to produce a 100 MHz unmodulated sinewave output, the level of the first harmonic at 200 MHz is 68.26 dB below the 100 MHz signal. The 300 Hz 2nd harmonic is 70.44 dB down, and the 4th harmonic at 500 MHz is 79.83 dB down. There are also some visible spurious outputs at various frequencies, but there are accessory filters available for the device which would clear most — if not all — of these up. There are also some adjustments in the software which might reduce these, but I didn’t play around with those. Again, I’ll let my buddy (to whom this device belongs) toy around with all those options if he needs the device to have cleaner output than it has as currently configured. I also noted that the output amplitude is now measuring 0.21 dBm with the device set for 0.0 dBm output, so the amplitude is now much closer to the set value than before. I’m guessing that mounting the device in an enclosure would improve its stability. There is also an OCXO option available when ordering the device/kit, which would likely improve its frequency stability and overall performance.
The output frequency measured 100.000003 MHz (a 3 Hz error) during this follow-up/additional testing, which is a miniscule 0.03 ppm error, so unless it drifts further than that, I’d say the stability is still looking really good. I do plan to let it sit on the lab bench powered-off for a few hours then restart it to see how accurate the output frequency is up a recheck.
Recent Comments